Posts Tagged ‘stock market’
Uptrend – June 14, 2013
The market went into a new uptrend again yesterday with the strongest percentage gain since January 2. This is only two days after it went into a downtrend. With the increasing weakness that the market has shown in recent weeks, there is a chance that the signaled uptrend might not follow through. Continue to watch the market action closely and especially the action of leading stocks.
Uptrend – April 29, 2013
The stock market entered into a new uptrend today with the Nasdaq breaking through 3,300 and setting a multiyear high not seen since Nov. 8, 2000.
Downtrend – April 18, 2013
The market went into a downtrend again yesterday with all major indexes falling hard on high volumes. The Nasdaq closed below it 50 day moving average for the first time this year.
Uptrend – March 6, 2013
After only a short week of trending down the market went into a new uptrend yesterday. The Dow Jones made a new all time high while the Nasdaq and the S&P 500 met levels not seen since November 2000 and November 2007 respectively.
Uptrend – June 20th, 2012
The market switched to an uptrend today. One of several promising signs is that the market has been going up recently despite negative news. The Fed also announced today that they will extend operation TWIST (replace short-term bonds with longer-term debt) by $267 until year end.
Downtrend – May 5th, 2012
The uptrend that started just a little over a week ago was short lived, and ended officially with the market action yesterday. We are now back in the downtrend again that started on April 11th.
Turn to UPTREND
The market turned to an uptrend with yesterday’s increase in the S&P 500. We usually like to see a higher than 2% increase in the index to indicate high willingness by investors to get back into the market, but still 1.4% with other factors from yesterday’s trade was enough to switch the model to an uptrend.
Market in DOWNTREND, July 28th
We have had an unusually high number of high volume down days lately, which were topped off with a massive down yesterday, July 27th. The Nasdaq with its 2.6% had its largest loss in five months. Market action in the major indexes constituted yet another 90% panic selling down day.
I have said several times earlier that third year bull markets typically are trendless, and this year is continuing to prove to be typical in that respect. The S&P 500 has mainly traded between 1,250 and 1,350 all year. IBD illustrates the lack of trend in the market well in today’s newspaper: “Last year, the Nasdaq had an eight-week win streak in the first half and then rose in 10 of 11 weeks in the second half. Those kinds of streaks make for good trading. So far this year, the longest up streak on the Nasdaq has been three weeks.” This market action calls for increased patience and continued adherence to your trading rules. Remember that a new trend will eventually emerge.
The reason for increased volatility lately is due to the lack of agreement between US politicians on how to handle the debt situation. But such discussions are not a new phenomenon; they have been going on for about three quarters of a century. As Ritholtz.com reports: “The regular debt ceiling limit dance seems to evoke a fairly standard set of behaviors in the two major US political parties: Whichever party is out of power (White House, or Congress or both) threatens not to support raising the debt ceiling. Which ever party is in power talks about how irresponsible and dangerous such a move would be.”
I don’t think the market has much to fear as I assume that they will reach a solution shortly. Yet another short-term solution that is. But yesterday, uncertainty became a little too high for the market participants to handle and a enough collected their chips to turn the market around. There is a clear risk that the US will be downgraded, and as I have stated many times before I believe this will eventually happen, and I also believe that the US will go bankrupt, or come into a situation that would seem like a close relative to it. But if that decline to bankruptcy starts with this downtrend or not I cannot tell. History shows that no systematic changes are made until our whole financial system collapses, first at that point is there enough political will to make any substantial changes. And substantial changes are what is needed. The way we run our economy, on borrowed and printed money, is not sustainable in the long term. This is an economic experiment that we to a more or less extend have been running, and gotten addicted to, since the Great Depression. The longer it has run the more we have gotten addicted to it. If you feel like reading more on this topic read this excellent column from Bloomberg News.
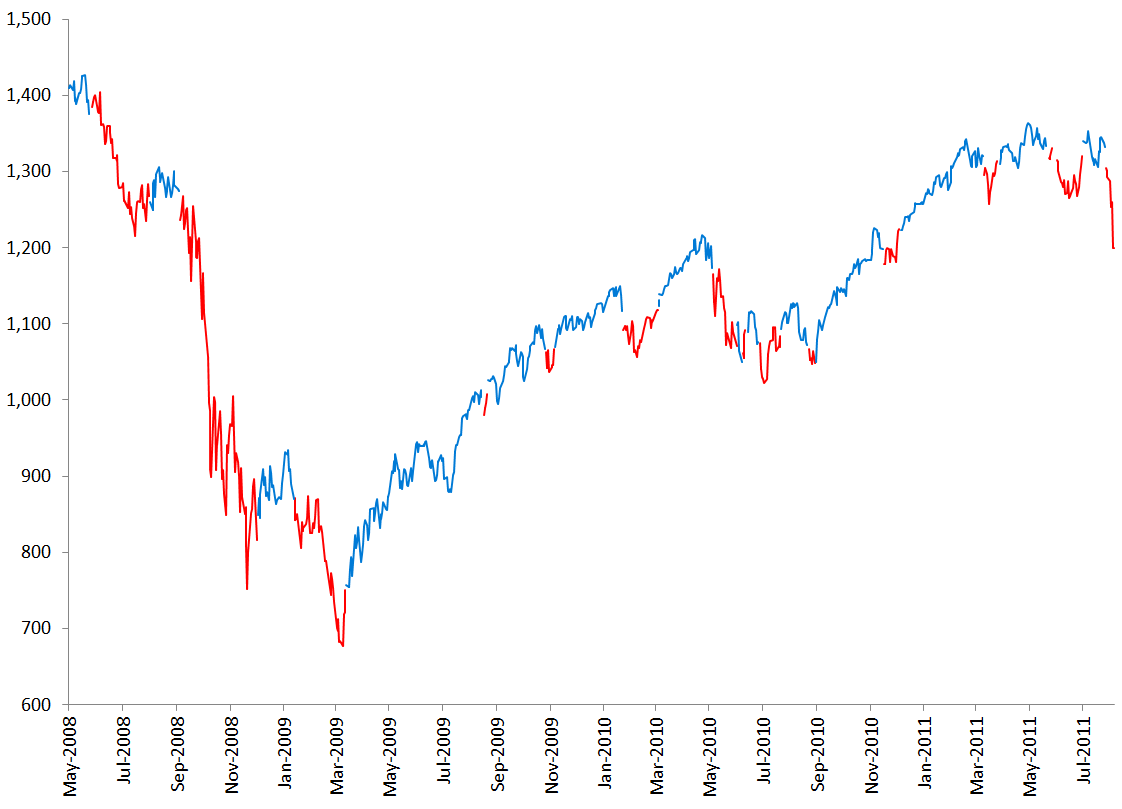
I have no clear perspective on the exact time for this collapse, and since I do not do any short term forecasting (only medium term and long term) I continue following my model which will in due course indicate when it is safer to enter a long-position in the market again. Remember that this is the same model that kept you out of the stock market during the crash of 2008 and indicated that it was “safe” to enter the market again on March 16th, 2009 just a few days after the market bottomed out. The model would have helped you avoid one of the last 100 year’s largest declines and also let you know when to return to the market again to participate in one of the last 100 year’s most rapid upturns!

